Last April 11, we conducted an experiment to verify two gas laws : Boyle’s and Charles’ Laws.
The ideal gas model is used to describe the behavior of dilute gases at low pressures and high temperatures. The ideal gas model is described by the Boyle’s Law, Charles’ Law, and Gay-Lussac’s Law. However, for this experiment Gay-Lussac’s Law will not be done.
So here’s a little background on the Boyle’s and Charles’ Laws.
Back in 1662, a guy named Robert Boyle discovered that at about one atmospheric pressure and at temperatures close to room temperature, the pressure and volume of gases are inversely proportional to each other and this relationship became known as Boyle’s Law. Boyle’s Law can be written mathematically as [1]

Equation (1)
where V is the volume of the gas, Cb is the proportionality constant which is equal to NkT, and P is the pressure. N is the number number of particles, k is the Boltzmann constant, and T is the temperature in Kelvin.
So the first thing we did was to set-up the experiment. First, a beaker was filled with water up to 3/4 full and the water was boiled. The water was boiled throughout the activity. The air chamber can was then connected to the mass lifter apparatus using the rubber tubing. The air chamber can was then placed in the hot bath. The piston was lifted to its maximum height and the gas pressure sensor was connected to the Vernier LabQuest. The temperature T was monitored throughout the experiment. A 50 g standard mass was placed on the platform of the mass lifter apparatus and the height h of the piston and the pressure P was recorded. The previous step was also done for the 100,150,200 and 250 g masses.
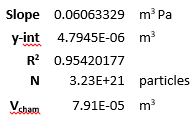
The volume of the cylinder Vcyl for each height was computed. The reciprocal P-1 of each pressure reading was computed. A plot of Vcyl vs P-1 was done. The number of particles N and the volume of the air chamber can Vcham were calculated from the slope and y-intercept, respectively.
The measured diameter of the piston was 0.0325m. Table 1 below shows us that as we increase the mass of the object that we place, the height decreases and the pressure increases as well.
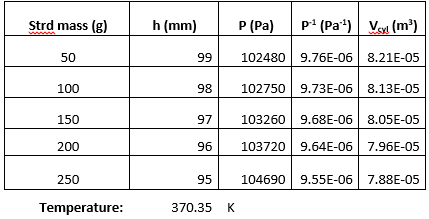
Table 1 .Experimental Data from the Boyle’s Law Experiment

Figure 1. Vcyl versus 1/P graph
The information that we got from the linear fit equation are the following :
The second part of the experiment was to conduct the Charles’ Law experiment. Back in 1780, Jacques Charles discovered that at temperature close to room temperature and pressure about one atmospheric pressure, the volume and temperature of gases are directly proportional to each other. This can be mathematically represented as [1]

Equation (2)
where Cc is the proportionality constant which is equal to Nk/P.
The first step in this part of the experiment was to remove the beaker (will serve as the hot bath) from the top of the stove. The air chamber was placed in the hot bath. The pressure P was monitored throughout the experiment. The temperature T of the hot bath was measured using a digital thermometer and the initial height h of the piston was recorded. Chunks of ice were slowly added on the hot bath while taking h and T measurements at equal time intervals. A V vs T plot was made. The number of particles N and the volume of the air chamber can Vcham were calculated from the slope and y-intercept, respectively.
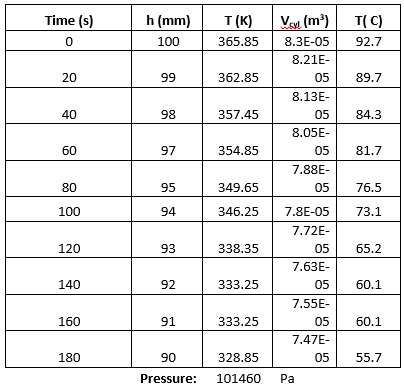
Table 2. Experimental Data from the Charles’ Law Experiment
The data from table 2 tells us that as the temperature decreased, the height decreased which means that the volume decreased.
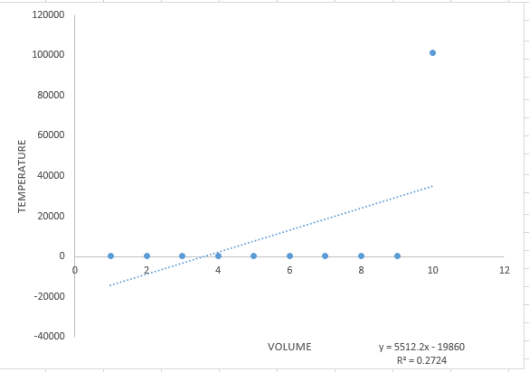
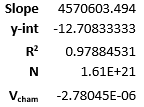
From the equation of the linear fit of the graph, we obtained the following data:
The experiment was a success in verifying Boyle’s and Charles’ laws.
References:
[1]Laboratory Manual Authors, Physics 73.1 Lab Manual. National Institute of Physics, UP Diliman.

Sobrang laki ng range ng y-axis mo sa plot sa Charles’ law. 🙂
LikeLike