
February 15,2016- This time we dealt with the wave property of light. Interference happens when light passes through very narrow slits. Interference is due to the concept of superposition. [1] Superposition can be constructive or destructive. It is constructive (light bands) when the waves that meet add up and the opposite for destructive interference (dark bands). The experiment’s main goal was to study the diffraction patterns through a single slit and through a double slit and their relationship with respect to the slit width.
The first part of the experiment revolved on single-slit diffraction.The laser was first set-up at one end of the optics bench and the single slit disk was placed in its holder 3 cm in front of the laser. We attached a white sheet of paper on a wall in such a way that the laser would hit it. The 0.04-mm width single slit was first selected. It was made sure that the slit and the patterns were the same level vertically. We measured the horizontal distance between the white sheet of paper and the slit disk. The lights were then turned off. We marked the boundaries of the dark fringes on the white sheet. Using a ruler, we measured the distance between the first order minima ( recorded as ΔY1)The distance between the second order minima was also recorded ( recorded as ΔY2). The diffraction pattern (up to second order) was sketched.
The same procedure was done for the 0.02 mm and 0.08 mm. The wavelength of the laser was then calculated. Since the value of the wavelength was printed on the label of the laser, the percent difference between the experimental and the theoretical wavelengths. The slit width was calculated twice, once using the data for the first-order minima and once using the data for the second-order minima. We also calculated the percent difference between the computed slit width and the value found on the slit label.
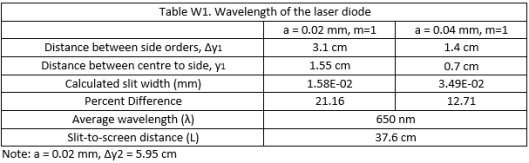
Table 1 above shows that as you increase the slit width from 0.02 mm to 0.04 mm, this would decrease the distance between side orders. The data that we obtained had percent errors greater than 10 due to the possibility that the marking of the center of the dark fringes may have been not too accurate.
Table 2 below shows that as you increase the order of the minima that you are measuring, the distance between the side orders will increase. The obtained wavelengths had percent errors that were close together and were close relative to the theoretical wavelength.
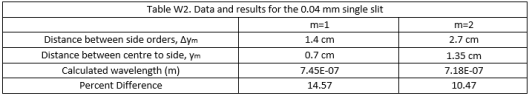
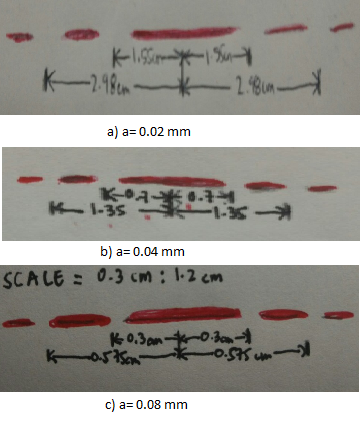
Figure 1. Sketches of diffraction pattern for various slit widths and fixed slit-to-screen distance
The second part of the experiment dealt with double-slit interference. The single-slit disk was removed and was replaced by the multiple slit disk. First a qualitative observation of double-slit interference was done. The variable double slit with 0.04 mm slit and slit separation varying from 0.125 mm to 0.75 mm. The interference fringes and the diffraction envelope were observed as the slit separation was varied. The double slit with 0.04 mm slit width and 0.25 mm slit separation was then selected. We then determined the distance from the slit disk to the screen. The diffraction envelope and the interference fringes inside it were observed. The boundaries of the dark fringes were marked and ΔY2 and ΔY2 were measured. Using the data, the slit width and the percent difference were calculated.

Table 3 above shows us that single-slit and double-slit interference are similar in a way that as you increase the order of the minima that you are measuring, the distance between the side orders will also increase. It was also observed that interference fringe visibility is inversely proportional to slit separation.
The last part of the experiment to observe what what happens when the slit width and slit separation were varied in a double-slit interference set-up. First, the double-slit interference pattern was projected onto the white sheet. The number of interference fringes located inside the central maximum was counted. The width of the central maximum was then measured and was divided by the number of interference fringes. We then sketched the double-slit diffraction pattern (up to the 2nd order minima).
The same procedure was one for
A) a=0.04 mm, d=0.50 mm
B) a=0.08 mm, d=0.25 mm
c) a= 0.08 mm , d= 0.50 mm
Table 4 below simply tells us that as you increase the slit separation distance, you increase the number of fringes in an interference envelope while slightly hanging the width of the central maximum ( hypothetically the width should not have changed). The fringe width also decreases as you increase the slit separation.

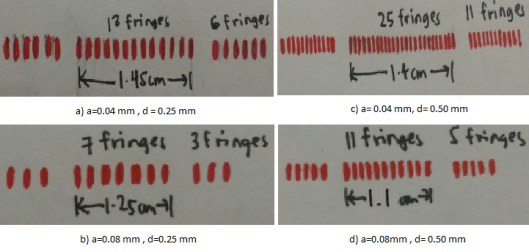
Figure 2. Sketches of interference pattern for various slit widths and slit separations
Figure 2 above shows that the fringes get compacted as you increase the slit separation.
Just like the first experiment, this experiment was fun because it dealt with a laser! I love lasers 🙂 Woo!
References:
[1]Laboratory Manual Authors, Physics 73.1 Lab Manual. National Institute of Physics, UP Diliman.
.

Hangganda naman ng drawing! Hahaha 😛
– Ma’am Anj 🙂
LikeLike